
Open the Van Alstyne Demographic Dashboard
How to use this tool:
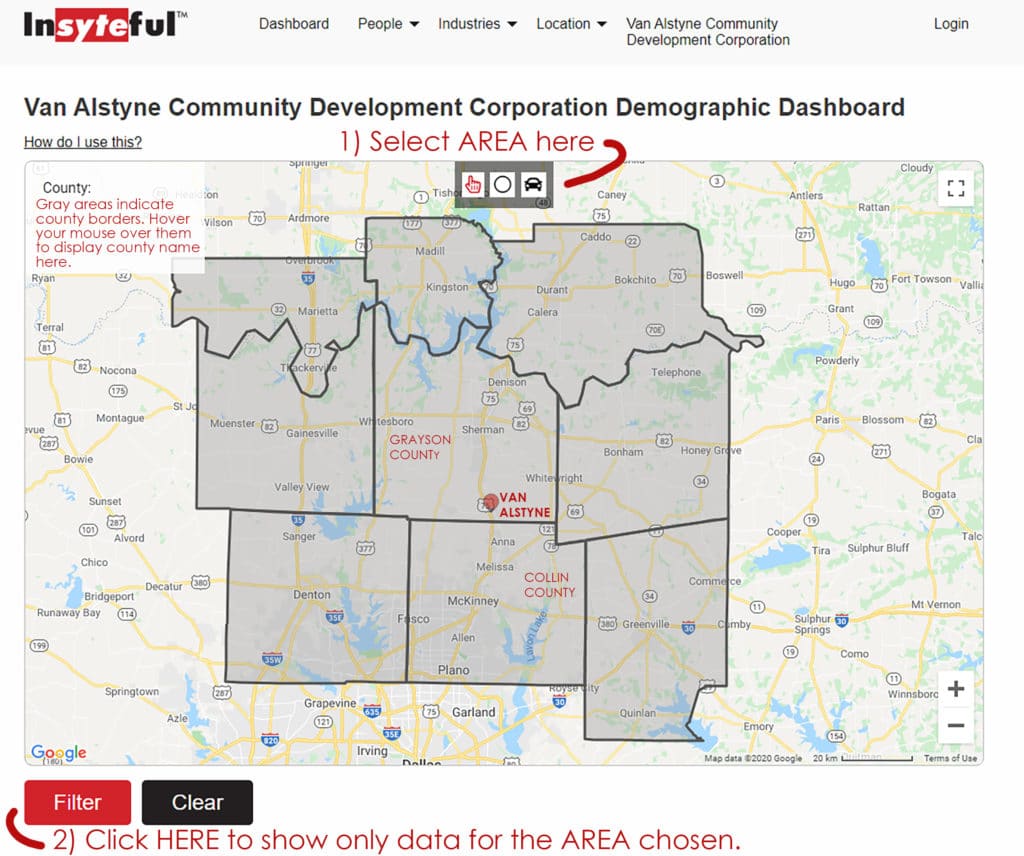
The counties the tool includes are shaded in gray. The data you first see on this page covers the entire shaded area. But, you can drill down to a more precise location:
- Select the area first. The marker below is Van Alstyne’s location on the map – remember this when you make your selection.
County select control: Click on a county to select it. Click on a selected county to deselect it.
Radius select control: Click and hold on a spot on the map to start a circle. Drag outwards to adjust the circle radius. Release the click to complete the circle.
Drive radius control: Click on a point on the map to set the radius center. Enter the drive time in minutes in the control. Click “Create drivetime radius”
Selection controls cannot be combined. Creating a new selection will clear the previous selection. - When you are happy with your selection, click “Filter” below the map to show data from your selection.
To remove all selection filters click “Clear” below the map.
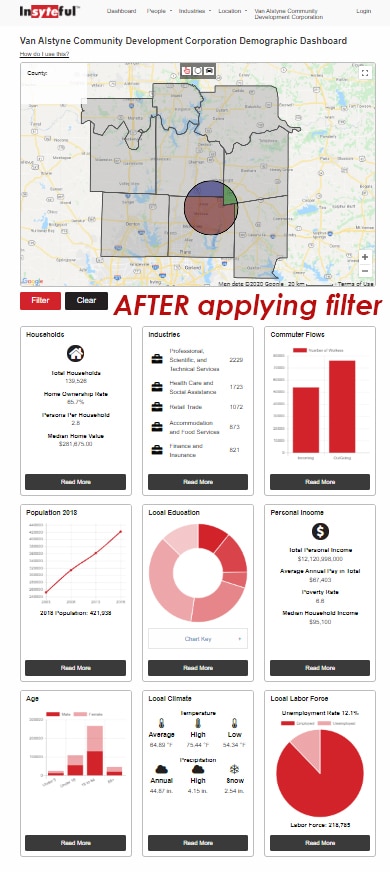 How can I filter Van Alstyne’s demographics?
- Households
- Industries
- Commuter Flows
- Population
- Local Education — level of educational attainment. Click READ MORE to see institutions of higher education (schools are sorted by enrollment size rather than by proximity)
- Personal Income
- Age
- Climate
- Labor Force — drill down for unemployment rate